Just like navigators use maps to get through vast seas, businesses can use process maps as a key step in process analysis to navigate complex processes and relationships.
Being able to clearly design your business processes helps you understand how your business process works. Process mapping helps you learn what needs improvement, along with your strengths. By using business process mapping symbols, such as ovals for start and end points, rectangles for tasks, and diamonds for decision points, businesses can clearly represent different components of a process.
Process mapping can also help businesses identify risks and compliance issues, optimize resources and workflows, and improve customer experience. Additionally, business process mapping can be used to develop process improvement initiatives and identify potential areas for intelligent automation.
What exactly is process mapping?
Business process mapping is a technique used to visually display how work is done in workflow steps from start to finish. A process map can also be called by different names, such as a flowchart, functional process chart, or workflow diagram.
Business Process Modeling Notation (BPMN) is often used in formal diagrams to provide a structured way to represent tasks and workflows, allowing for clearer communication and understanding of complex processes.
Process mapping helps organizations understand and improve their work processes by displaying a visual representation of their workflow. By mapping out processes, teams easily communicate priority issues and identify where time and resources are wasted.
With a detailed process map, teams must identify and understand individual steps, devise precise timelines, and identify task owners. Business process mapping brings lots of helpful insights but is just one step in the overall goal of a business process analysis.
What is business process mapping used for?
Process mapping is executed to establish an order for procedures, a necessary prerequisite for any Standard Operating Procedure (SOP). Certain enterprises use process maps as templates, guidelines, or diagrams for tasks. These are meant to help guide employees on how to carry out procedures.
Understanding the current process is a foundational step in business process mapping. Gathering information about the current process helps identify areas for improvement, engage stakeholders who manage and implement the process, and utilize process mapping tools for accurate documentation.
Relying solely on process maps without a business process management (BPM) platform often results in missed opportunities for improvement due to untracked metrics and key performance indicators (KPIs). Process mapping comes before a BPM platform and is the basis of the whole workflow engine.
With a BPM platform, your enterprise can track the amount of time it takes to complete a process, spot bottlenecks or time-consuming tasks, reinforce defined execution standards, automate work, and more.
How to create a business process map
Below is a step-by-step guide to help you map your business processes.
1. Meet with all of your process stakeholders
Before you begin process mapping, you will want to gather all of the stakeholders that will be affected by a process together. Changing processes will affect the way people work. Make sure your staff is prepared mentally for the transition and that you are establishing workflows that are conducive to their work.
2. Define the starting and ending points
Establish where a process starts and where it stops. Some processes are more complex than others and thus have multiple endpoints. Thinking of all possible outcomes is critical to avoid confusion later on.
3. List which actions are making the process actually work
List the steps that drive your process forward. An active voice with action verbs should be used to describe each task, such as “fill out request form” or “contact supplier.”
4. Determine a sequence order
After defining the tasks that move your process from start to finish, now you need to put them in chronological order. Each action is supposed to trigger the following step in the sequence.

Common BPMN symbols. Sourced by Lucidchart.
5. Mark with appropriate symbols
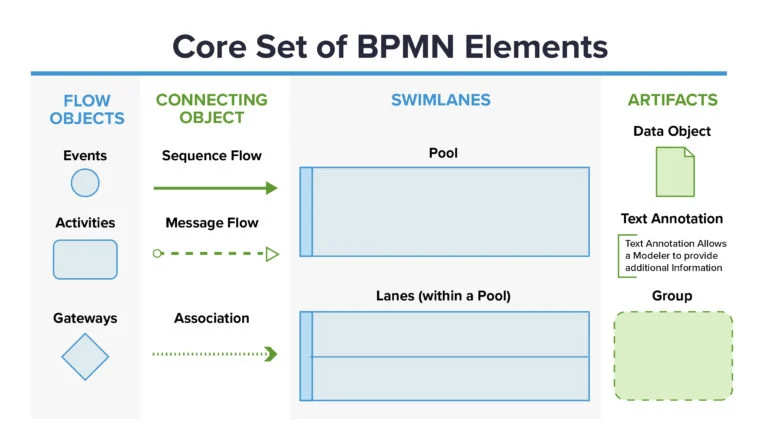
When marking workflows, you’ll want to ensure you are following BPMN 2.0, the universal notation for business process modeling. BPMN consists of three main elements: events, activities, and gateways. To connect these three main elements, a fourth element can be used, something called the “sequence flow.” These are the black lines with arrows that connect everything together.
6. Test
Once your diagram is complete, ensure each process works as originally designed. Are your employees following the correct steps?
Once you’ve completed the main steps of business process mapping, it’s time to go one step further and implement the culture of continuous improvement with the next concluding steps.
7. Analysis
The analysis phase is about working through the map to identify opportunities for improvement. Good questions to ask in the analysis are: can steps be eliminated? Can tasks be completed more efficiently? Are there potential bottlenecks slowing down the throughput time? Analyzing the entire process is crucial to identify dependencies and inefficiencies.
8. Develop new methods of work
Once you have worked out the areas for improvement in work processes, it’s time to eliminate unnecessary actions and manual work, rearrange or automate business process steps, and develop more effective workflows.
9. Process management
This final phase is about maintaining effective processes with regular reviews and progress monitoring. The most effective process map is one that is kept fresh and used actively.
The biggest benefits of process mapping
1. Sharing visual information, data, and ideas
Process mapping allows teams to communicate complex information more effectively. By creating visual representations of processes, it becomes easier to convey information, share ideas, and discuss potential improvements. Visual maps enable stakeholders to grasp the workflow steps and understand the relationships between different tasks, fostering collaboration and knowledge sharing.
2. Providing digestible information for effective problem-solving
Complex processes can often be overwhelming, making it challenging to identify bottlenecks or areas for improvement. Business process mapping breaks down these intricate workflows into easily understandable symbols and steps. This simplification helps stakeholders gain a clear understanding of the process, enabling them to identify inefficiencies and propose solutions more efficiently. Different mapping techniques, such as flow charts and swim-lane diagrams, facilitate this understanding by providing visual representations of the processes.
3. Breaking complex processes down into universally understood symbols
Process mapping utilizes universally recognized symbols and notations, making it easier for individuals across different departments and teams to comprehend the workflow. Regardless of their expertise or background, employees can understand the process represented on the map, facilitating cross-functional collaboration and fostering a shared understanding of the organization’s operations.
4. Providing a visual representation of the process from start to finish
One of the primary advantages of business process mapping is its ability to provide a comprehensive visual representation of a process, from its initiation to its completion. This end-to-end overview helps stakeholders identify dependencies, redundancies, and potential areas for optimization. It also enables them to track the progress of tasks, ensuring accountability and timely completion. A value stream map, a specific type of detailed flow chart used in Lean Six Sigma methodology, is particularly effective for illustrating complex processes and identifying areas for improvement.
5. Building alignment and prioritization between various individuals and teams
Business process mapping brings individuals and teams together by providing a shared understanding of the organization’s objectives and processes. By visualizing the workflow, stakeholders can align their efforts, identify interdependencies, and prioritize tasks accordingly. This alignment enhances collaboration, minimizes misunderstandings, and improves overall efficiency.
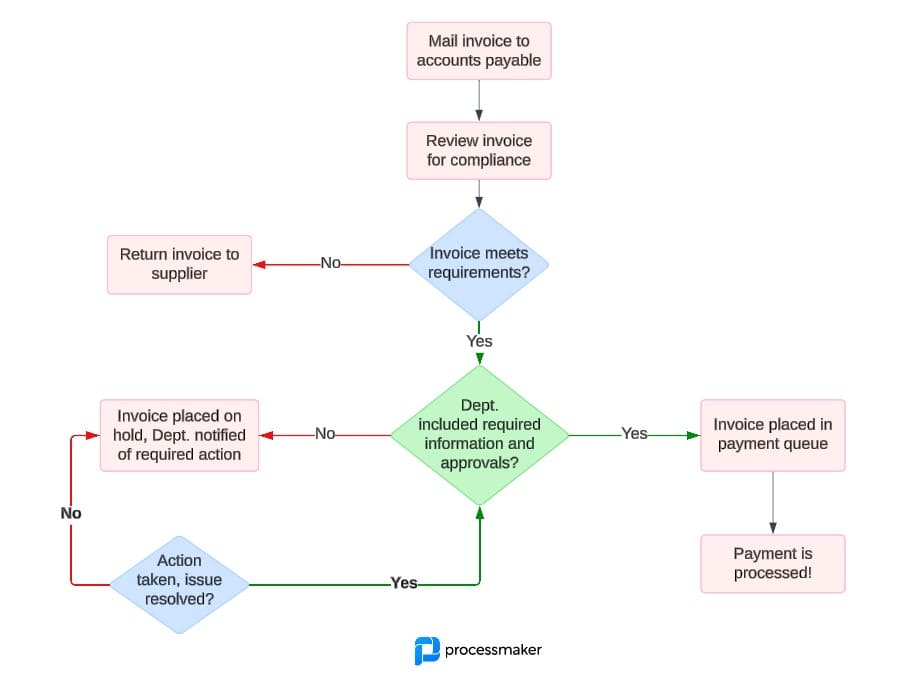
Invoice payment process flowchart
Who maps the processes?
In most companies, the job of mapping processes is usually given to the Business Analyst or Process Improvement teams. These teams have the knowledge and expertise needed to understand the complexities of different business processes and turn them into visual representations.
The Business Analysts work closely with stakeholders from different departments, having discussions, conducting interviews, and gathering data to fully grasp the existing processes. Using this information, they can create business process maps that accurately show the steps, dependencies, and interactions involved in each process.
Process mapping is a collaborative effort that involves the participation of individuals who have a deep understanding of the processes being mapped. This ensures that the process maps truly reflect how work is being carried out in the organization. While Business Analysts or Process Improvement teams usually take the lead, the involvement and input of stakeholders from various departments are crucial to ensuring the business process maps are both accurate and relevant.
Process Mapping vs. Process Modeling
Process mapping is a valuable technique used to gain a comprehensive understanding of established processes within an organization. It involves creating visual diagrams that depict each activity, providing a clear and tangible representation of the overall business process landscape. This approach allows teams to identify the current state of processes, highlighting their sequence and dependencies. Process documentation plays a crucial role in supporting business operations by creating a clear blueprint of core processes, ensuring consistency, and facilitating process improvement initiatives.
On the other hand, process modeling takes a broader perspective by focusing on the desired state of processes within the entire organization. It enables teams to envision and design an optimized workflow that supports the lifecycle of processes and fosters continuous improvement. Business process modeling goes beyond simply mapping out the existing processes; it aims to create an ideal representation of how processes should be, considering factors such as efficiency, effectiveness, and resource allocation.
In simple terms, business process mapping provides a visual snapshot of the current state of business processes, while process modeling delves into the realm of optimization and simulation. Process mapping and business process modeling are complementary techniques. The former provides a foundation for understanding existing processes, while the latter enables organizations to optimize and simulate improved workflows. Both methods go under the larger Business Process Management effort.
6 typical process map types
- Flowcharts
Start with the basics. Flowcharts are easy-to-follow visual maps that almost everyone can understand. Flowcharts provide basic process details such as inputs and outputs.
- Deployment maps
Deployment maps (or cross-functional flowcharts) are ideal for finding those pesky bottlenecks. Deployment maps display relationships between different teams and use swimlane diagrams to illustrate how a process flows through your organization.
- Detailed process maps
As the name suggests, detailed process maps show a deeper version of a process and contain information about sub-processes.
- High-level process maps
High-level process maps are all about seeing the bigger picture. Otherwise known as value-chain or top-down maps, high-level process maps include the key process elements such as a supplier, process, output, input, or customer.
- Rendered process maps
Rendered process maps show current and/ or future state processes. This information highlights areas for improvement.
- Value stream maps
The final step is documenting the steps needed to develop products and services for an end user.
Process mapping symbols and their meanings
Process symbols are a representation of individual elements in a process map. Otherwise known as flowchart symbols, flowchart shapes, or flow diagram symbols, process symbols have specific meanings. Like the musical notes printed on piano sheet music, process symbols are universal and have specific meanings.
Common process mapping symbols
7 popular process mapping tools
There are many business process mapping tools to choose from, but five of the most popular tools are:
ProcessMaker
ProcessMaker offers an AI-powered process mapping functionality within its larger business process automation platform.
Microsoft Visio
Now part of the Microsoft Office pack, Visio is a diagramming and vector graphics application initially released in 1992. Microsoft Visio is widely used to create flowcharts and process maps.
Lucidchart
A popular web-based diagramming application for visual collaboration and drawing. Users can revise and share charts and diagrams to improve processes, systems, and organizational structures.
Diagrams.net
This freeware design tool can integrate with Google Documents and other online-based tools providing flexible diagram visualization options. While it does not offer an advanced collaboration functionality, its ease of use and zero cost make it a popular choice for beginners.
Gliffy
Users diagram via an HTML5 cloud-based app and can create UML diagrams, floor plans, Venn diagrams, flowcharts, and more. Users can share and edit diagrams in real time.
Cacoo
Launched in 2009, this web-based software is for designing and drawing diagrams. The tool creates flowcharts, wireframes, organizational charts, and more.
SmartDraw
Teams use this collaborative web-based diagramming tool to work on flowcharts, mind maps, and many other business visuals.
Bottom line
Process mapping helps companies become more efficient with clear insights and defined goals to save time, money, and staffing. However, business process mapping was often a time-consuming and complex endeavor. Thankfully, things have changed.
With ProcessMaker, you can automatically track processes without the hassle of slow, manual work. What’s more, you’ll get real-time actionable insights from day one thanks to AI-powered process intelligence software.
So steer your company in the right direction today by booking a meeting, and make business process mapping a breeze.