Ever wished you could improve efficiency, reduce costs, and provide scalability in operations? We’re guessing your answer is “yes.” This is all possible with intelligent automation and business process modeling.
What is business process modeling?
Business process modeling is a powerful technique that is used by organizations to improve efficiency, reduce costs, and provide scalability in operations. This technique is the practice of creating graphical representations or models that illustrate the steps, activities, and interactions involved in a business process.
Business process modeling helps in visually capturing the flow of work, information, and resources within a process, making it easier to identify inefficiencies, bottlenecks, and areas for improvement. The models typically use standardized notation, such as Business Process Model and Notation (BPMN), to ensure clarity and consistency in communication.

Business Process Modeling benefits
Business process modeling offers numerous advantages that facilitate organizational efficiency and improvement. Here are some key benefits:
- Improved communication. Visual representations of processes help bridge communication gaps between technical and non-technical stakeholders, ensuring everyone shares a common understanding.
- Increased efficiency. By identifying bottlenecks and redundancies, businesses can streamline operations, reducing wasted time and resources.
- Enhanced process control. With detailed insights into each step, organizations can maintain better control over processes, ensuring compliance and consistency across operations.
- Facilitated training. New employees can grasp workflows more quickly with clear process models, accelerating the onboarding process and reducing training costs.
- Risk management. Modeling helps identify potential risks and develop mitigation strategies, providing a proactive approach to managing challenges.
Top 5 business process modeling tools
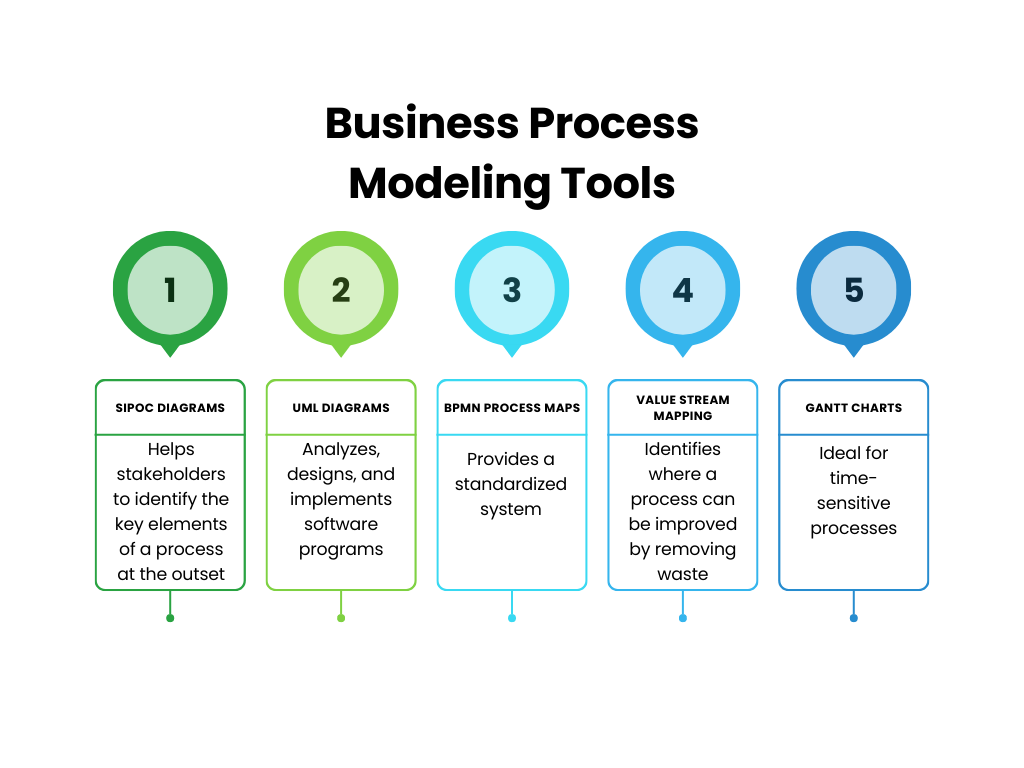
With the increasing need for efficiency and scalability, choosing the right business process modeling tool can prove to be a game-changer. In this chapter, we’ll uncover the functionalities of five different BPM tools that can help streamline your operations and bring about optimal business performance.
SIPOC diagrams
SIPOC diagrams are a tool used in the Six Sigma methodology. Six Sigma was created in 1986 by an American Engineer named Bill Smith and provides various techniques and tools for process improvement. One of these business process modeling tools is a SIPOC diagram.
SIPOC is an acronym that helps stakeholders to identify the key elements of a process at the outset. The ‘s’ in SIPOC stands for suppliers. The ‘i’ for inputs. The ‘p’ for the process that you intend to improve. The ‘o’ for outputs. The ‘c’ is for customers for whom the outputs are intended.
When completing a SIPOC diagram, each letter of the acronym is typically written at the top of a column in a table format. Stakeholders then list out the key elements in each category.
Prior to completing the list, however, the existing business process should be mapped out. This provides stakeholders with a visualization of how a process works and helps to identify the elements that are the subject of the acronym.
UML diagrams
UML, short for Unified Modeling Language, diagrams were developed by software engineers but have become one of the most popular business process modeling tools. UML was created to provide a standardized way to analyze, design, and implement software programs.
There are some 14 different types of UML diagrams, several of which are useful as business process modeling tools. These diagrams fall into two larger categories – structural and behavioral diagrams. Structural diagrams analyze the structure of a process, while behavioral focus on its actors and various components.
The most used behavioral diagrams are activity diagrams. They are used to illustrate the flow of different processes. Other common ones include use case diagrams and interaction overview diagrams. Commonly used structural UML diagrams include class diagrams, object diagrams, and component diagrams.
BPMN Process Maps

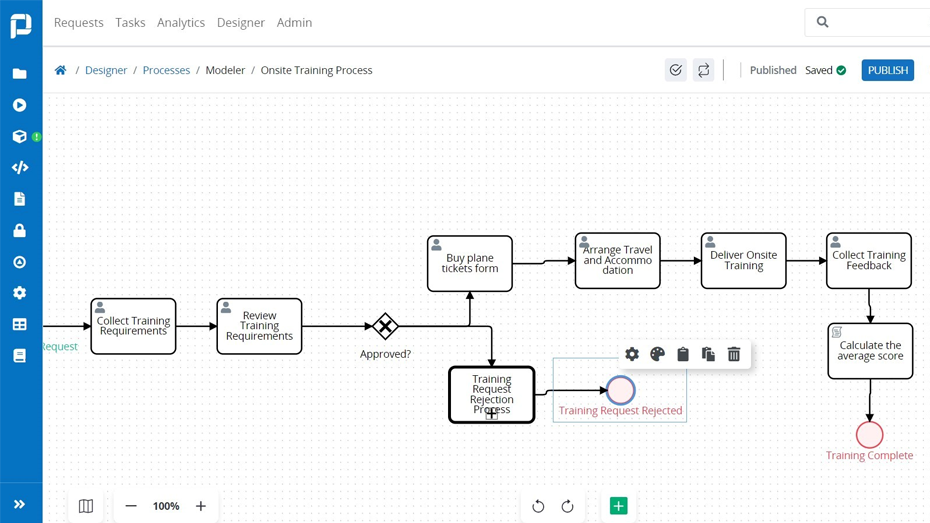
Example of a process map created with a ProcessMaker software
BPMN, or Business Process Modeling Notation, process maps are essentially an extension of UML. But unlike UML, BPMN was created solely to provide a standardized system for the purposes of business process modeling. BPMN is essentially a flow chart method that illustrates all steps of a business process in hyperautomation. One of its benefits is its flexibility, allowing stakeholders to create diagrams that serve various purposes.
For example, BPMN diagrams can be used to provide stakeholders with a broad overview of a process. They can also be used to create highly detailed diagrams that provide practical guidance to the stakeholders responsible for performing tasks. It achieves this using a standardized system of elements and symbols. The four common elements of business process diagrams are:
- Flow objects: These include events, activities, and gateways.
- Connecting objects: Solid lines indicate the transfer of tasks, while dashed ones are messages.
- Swim lanes: These detail responsibilities for sub-tasks and the people or departments responsible for completing them.
- Artifacts: These are used to add information to a diagram that is not sequence or message flows.
Value stream mapping
Value stream mapping is used to illustrate the steps in a business process. The primary goal of this methodology is to identify the places where a process can be improved by removing waste. There are several different types of waste that stakeholders seek to identify. These include:
- Waiting: This is a production delay caused by a bottleneck in a previous process.
- Motion: Unnecessary steps that result in a task taking longer and costing more.
- Transport: Reducing steps involving the transport of supplies or information.
- Overproduction: Producing more than demand results in waste or storage costs.
- Over-processing: Taking too long trying to be perfect rather than transitioning to the next phase.
- Defects: Requires doing over or producing an item that must be scrapped.
Gantt charts
Gantt charts are generally used less than the other business process modeling tools we discussed above. Part of the reason is that Gantt Charts were developed over 100 years ago, and more sophisticated business process modeling tools have since emerged. Gantt charts are simple diagrams that provide a visualization of the time associated with specific tasks. For instance, Gantt charts show the start and end times of a process and how long each took to complete.
Thus, Gantt charts are ideal for time-sensitive processes. They show stakeholders when particular tasks should begin and end and whether processes are being completed on schedule. Gantt charts are not, however, well-suited for complex business processes.
How BPM Generates Hyper-Productivity
Business process modeling is a powerful tool that generates hyperproductivity within organizations. By meticulously mapping out the intricate steps and interactions involved in various business processes, companies gain a comprehensive understanding of their operations.
This clarity allows for the identification of inefficiencies, redundancies, and bottlenecks, enabling the fine-tuning and optimization of workflows. As a result, resources are allocated more efficiently, and tasks are streamlined, leading to faster and more accurate execution. Moreover, process modeling facilitates the implementation of automation and technology solutions, which further enhances productivity by reducing human error and speeding up routine tasks.
Businesses that embrace process modeling are better equipped to adapt to changing market conditions, make data-driven decisions, and achieve unprecedented levels of productivity, positioning them for long-term success in today’s competitive landscape.
Chat with our experts to learn how you can leverage process modeling in your organization.


