It goes without saying that metrics play a pivotal role in business process analysis. They help define the performance levels expected of their processes and operations. Not only that, the right process metrics allow you to identify inefficiencies, evaluate the impact of process changes, and drive continuous improvement.
You’ll find everything from process metric types to examples and best practices, so let’s get started!
Why are metrics important in business process management?
Process metrics provide the data and insights to objectively evaluate how business processes are working and whether they align with the company’s goals.
Process metrics also facilitate evidence-based decision-making, enabling enterprise leaders and teams to make informed decisions to manage business operations, process redesign, and strategic planning.
How are KPIs different from process metrics?
While they’re often used interchangeably, Key Performance Indicators (KPIs) and process metrics have slight differences. KPIs can be seen as a subset of metrics, often tied directly to the organization’s strategic objectives typically within a defined timeframe, like monthly or quarterly targets. Quite simply, the KPIs are a snapshot of the overall health and success of the business.
On the other hand, process metrics are specific measures that focus on the performance of particular business processes. They monitor and evaluate the efficiency, effectiveness, and flexibility of a process, helping businesses to identify where improvements are needed. Process metrics can be time-bound targets, but they can also be used to measure continuous improvement.
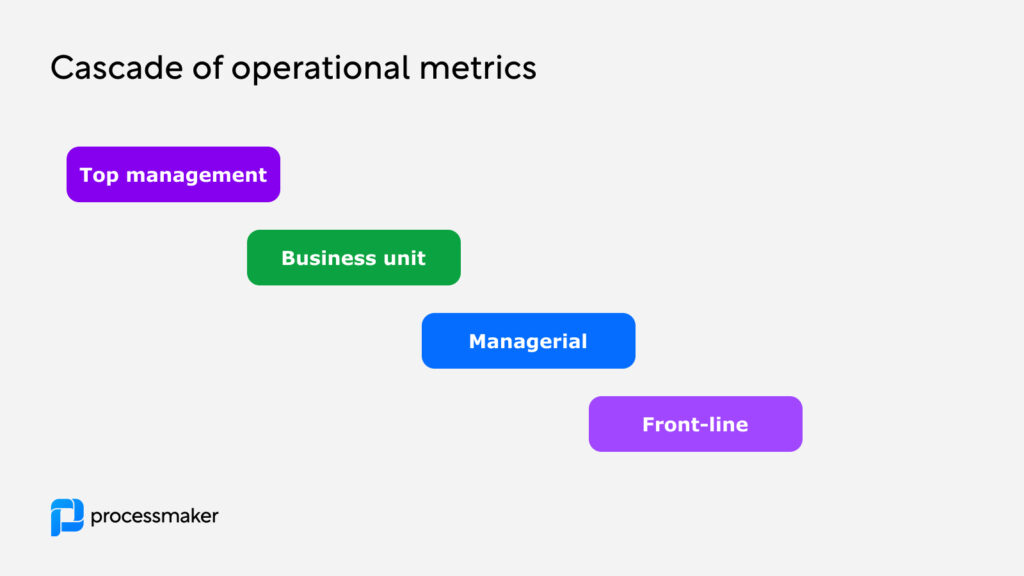
Who should decide on process metrics?
There is no simple answer to ‘who should decide process metrics. It’s neither a top-down nor bottom-up decision, but more of a cascade of action-oriented measurements based on strategy across different levels of the organization.
What types of metrics and KPIs can you use to measure processes?
Process metrics can be broadly categorized into five types:
- Process efficiency metrics – measure the resources used to complete a process.
- Process variance metrics – measure variation in standard processes over time.
- Process effectiveness metrics – measure the success of a process in achieving its desired outcome.
- Process control metrics – evaluate conformance to business rules and regulatory standards.
- Continuous improvement metrics – measure the impact of process improvements over a longer time period or against agreed objectives.
Process efficiency metrics
Efficiency metrics are used to measure the performance and productivity of a business process. They evaluate how well a process uses resources, including time, money, and manpower, to deliver outputs. By looking at these metrics, businesses can identify areas where waste can be reduced and process speed can be increased.
Examples of efficiency metrics include:
- Cycle time: This is the total time taken to complete a process from start to finish. A shorter cycle time may signify a more efficient process.
- Cost per transaction: This measures the total cost to carry out a process for each transaction. By reducing this cost, businesses can increase the profitability of each transaction.
- Resource utilization: This measures the percentage of available resources that are used in a process. Higher utilization generally signifies more efficient use of resources.
Process variance metrics
Variance metrics evaluate the consistency of a process. They measure the difference between the actual process performance and the expected or standard performance. By analyzing variance metrics, businesses can understand the degree of unpredictability or risk in a process.
Examples of variance metrics include:
- Standard deviation: This measures the amount of variation or dispersion in a set of values. A low standard deviation indicates that the values are close to the mean, implying a more consistent process. Standard deviation can be measured as part of process variation analysis, or through various Six Sigma initiatives.
- Range: This is the difference between the highest and lowest values in a set. A smaller range suggests less variance and more consistency in the process. The Pareto principle can visualize the range in process performance, where typically 80% of outcomes result from 20% of causes.
Effectiveness metrics
Effectiveness metrics measure the ability of a process to achieve its intended results. They focus on the quality and outcomes of a process, rather than its efficiency.
Examples of effectiveness metrics include:
- Customer satisfaction or CSAT: This measures how well a product or service meets or exceeds customer expectations. Higher customer satisfaction scores often indicate a more effective process.
- Error rate: This measures the number of errors or defects produced during a process. A lower error rate suggests a more effective process.
- Quality rate: This is the proportion of output that meets a specified quality standard. A higher quality rate suggests a more effective process.
Process control metrics
Control metrics are used to monitor compliance and conformance within a business process. They help to ensure that processes are operating within acceptable parameters and complying with relevant regulations and standards.
Examples of control metrics include:
- Compliance rate: This measures the extent to which a process complies with a set of standard rules or regulations. A higher compliance rate indicates a more controlled process.
- Risk incidents: This measures the number of times risks identified in the process have occurred. Fewer risk incidents imply a better-controlled process.
Continuous improvement metrics
Improvement metrics assess the impact of changes made to multiple business processes. They help to quantify the benefits of process improvements, which can include cost savings, improved efficiency, better quality, or higher customer satisfaction.
Examples of continuous improvement metrics include:
- Cost: This measures the cost efficiency or effective savings realized from implementing process improvements. The total cost of ownership calculations or should-cost modeling can help analyze and drive the cost benefits of continuous improvement.
- Improvement in cycle time: This measures the decrease in cycle time after implementing improvements. A larger decrease in cycle time indicates more effective improvements.
- Reduction in error rate: This measures the decrease in error rate after implementing improvements. A larger reduction indicates more effective improvements. In services, the error rate can also be measured by the amount of re-work.
Each type of process metric provides a unique perspective on a process’s performance, and together, they offer a comprehensive view of process efficiency, effectiveness, variability, control, and improvement.
How to use process metrics to improve operational excellence?
Process metrics provide a tangible method to monitor the progress of strategic goals, making it easier to track and manage operational success. They start with purpose and strategy and only then do they go to performance.
Using metrics to improve operational performance
Operational performance directly correlates to a company’s success, marking its significance in every field of business. Different industries have varied KPIs and metrics reflecting their operational performance. However, certain metrics are universal and beneficial for all types of businesses.
Operational efficiency metrics
These metrics help determine the time and resources required to deliver a product or service. They include metrics like cycle time, throughput, and capacity utilization.
Quality metrics
Quality metrics measure the level of quality delivered through your operations. They include indicators like defect rates, return rates, amount of rework, and customer satisfaction scores.
Cost metrics
Cost metrics identify the total cost of producing a service or product. They can help manage expenses and enhance profitability. Examples include cost of goods sold (COGS), operating expense ratio (OER), and cost variance.
Capacity metrics
Especially in service-based teams and functions, you may have metrics related to the capacity and tasks assigned to teams and individuals. The objective here is to ensure that everyone has sufficient resources to complete their tasks successfully.
How to use metrics to redesign existing processes?
Process metrics are an indispensable tool in business process redesign as they provide an evidence-based framework for identifying inefficiencies and measuring improvements. Metrics can help you re-engineer key processes and provide a tangible way to measure the results of your changes.
Process re-engineering can be complex and resource-intensive. Without metrics to guide your decisions and validate your efforts, you might end up investing a lot of time and money into changes that yield little improvement in operational performance.
Processes start from input > process > output, while key measures work from output > process > input in the opposite direction. It’s good to start from the desired outcome and go in the other direction. Start with the output and decide what is the acceptable level of achievement.”
Here is a simple four-step method for utilizing metrics in process improvement and redesign:
- Identify inefficiencies. Metrics can help identify processes that are underperforming or inefficient. These become the primary targets for redesign.
- Set goals and benchmarks. Once the problematic processes have been identified, metrics can be used to set goals and benchmarks for the redesigned process.
- Measure the impact of process redesign. After the processes have been redesigned, the same metrics should be used to evaluate the effect of these changes. This helps ensure that the changes made have led to improvements and helps identify any additional tweaks that might be necessary.
- Monitor and adjust. Post-redesign, continue using the metrics to monitor the processes regularly. This allows for early identification of any new inefficiencies and ensures that the redesigned process remains effective over time.
How to choose the right business process metrics
Selecting the appropriate business process metrics is a crucial aspect of any business’s strategic planning. These metrics not only guide the decision-making process but also provide a basis for continuous improvement. The right metrics can offer clear insights into efficiency, quality, and profitability, assisting in identifying areas for improvement.
- Identify your business goals. What are you trying to achieve? Your business goals will guide your choice of metrics.
- Determine the processes that align with these goals. Identify the processes that directly impact your goals. These are the ones you want to track.
- Select your key metrics. Choose relevant, measurable, and understandable metrics that align with your business goals and processes.
- Implement, track, and review. Implement your chosen metrics, track them regularly, and review them to ensure they’re providing the insights you need. Be prepared to tweak or change your metrics if they’re not giving you the information you need.
What makes good process metrics and KPIs
Metrics themselves don’t improve processes – but the appropriate measurements can help you diagnose existing processes and set you on a path to process improvement.
How do you know you’ve set the right metrics?
Relevance
The metrics you choose should be relevant to the specific business process you’re analyzing. They should directly reflect the efficiency and effectiveness of the process and provide actionable insights.
Measurable
A good metric is quantifiable. It’s vital to choose metrics that can be clearly measured and tracked over time. For example, you might measure the time it takes to complete a certain process, the cost involved, or the number of errors made.
Simple and understandable
Metrics should be easy to understand and interpret. If a metric is too complex or obscure, it won’t effectively communicate the information needed to make improvements.
Aligned with business goals
Ensure that your metrics align with your overarching business goals. If your business aims to improve customer satisfaction, for instance, consider metrics related to customer feedback, resolution times, or return rates.
Five best practices for effective process metrics
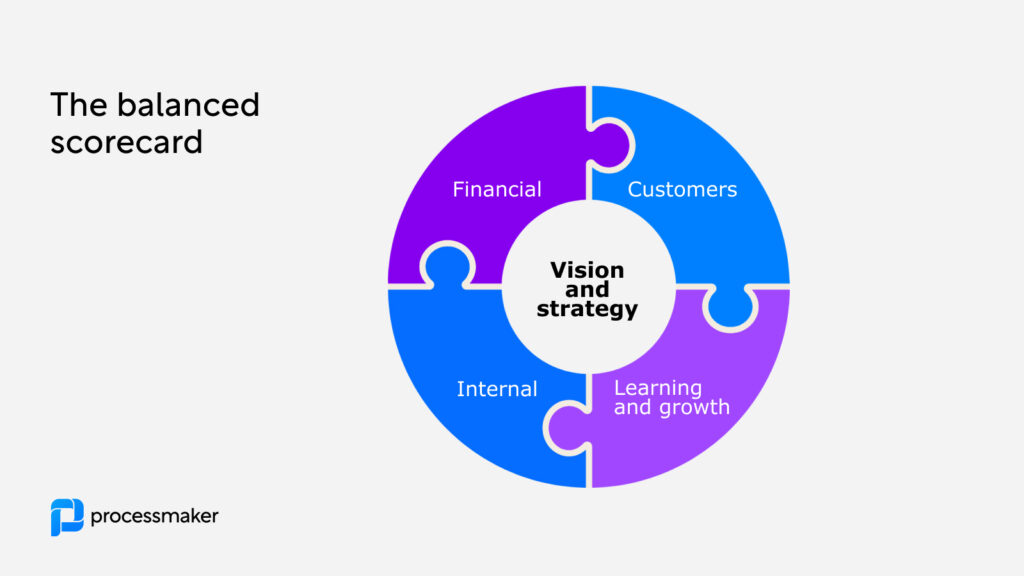
Tip 1: Look for a balanced scorecard
One best practice is utilizing the Balanced Scorecard model developed by Dr. Robert Kaplan and Dr. David Norton.
Tip 2: Don’t just rely on standard metrics
You shouldn’t measure things just because they are industry standards. For example, measuring average handling time in call centers doesn’t always make sense and only matters if it can be tied to positive behavior and performance. Otherwise, if the metric is to close phone calls down, that’s what people will do. Irrespective of whether the customer has been served or the case has been handled.
Tip 3: Measure for a reason with a consequence
Everything you measure needs to be for a reason with a consequence. It’s important to figure out not just what to measure, but also what actions to take, and what to do if things don’t go right. You need to create metrics to act and actively manage your performance.
Tip 4: Combine metrics with related documentation
Another best practice is pairing measurement with process documentation. In some companies, this may come in the form of standard operating procedures (SOPs), but on a tactical level, this can also be documentation about how tasks are performed.
Sometimes you may find that processes are not being adhered to because someone has found a better way of working. Other times, things get added or work becomes more difficult over time. In order to manage this, one should stay on top of their processes and document all of these variances.
Tip 5: Prioritize leading indicators
The final tip would be to prioritize leading indicators over lagging indicators to see the impact on operational performance and process improvement.
Leading indicators are measurable factors that reveal potential issues before they become operational challenges. They can be used to predict and anticipate future events or trends and optimize capacity proactively based on market and supply dynamics.
Bottom line
In this article, we went through how to effectively use metrics in business process analysis with examples and best practices.
To summarize, process metrics are quantifiable measures used to determine the success or progress of a business process. They serve as a critical tool for assessing current performance, setting objectives, and evaluating improvements.